Rete Dafne

A nationwide association to provide a network of assistance, information and protection to victims of crime in Italy.

  • App for data management

  • Interactive Map

  • Data Visualisation

  • Web Site

  • Content Strategy

Development of digital information and monitoring systems that can be consulted at both public and private level, unified by a solid and nationally recognizable image. 

Rete Dafne was born in 2017,  made up of a network of collaborations between local administrations, health agencies, judicial authorities, law enforcement agencies, private social associations whose purpose is to care for people that have suffered as a result of a crime.

  • Brand Identity

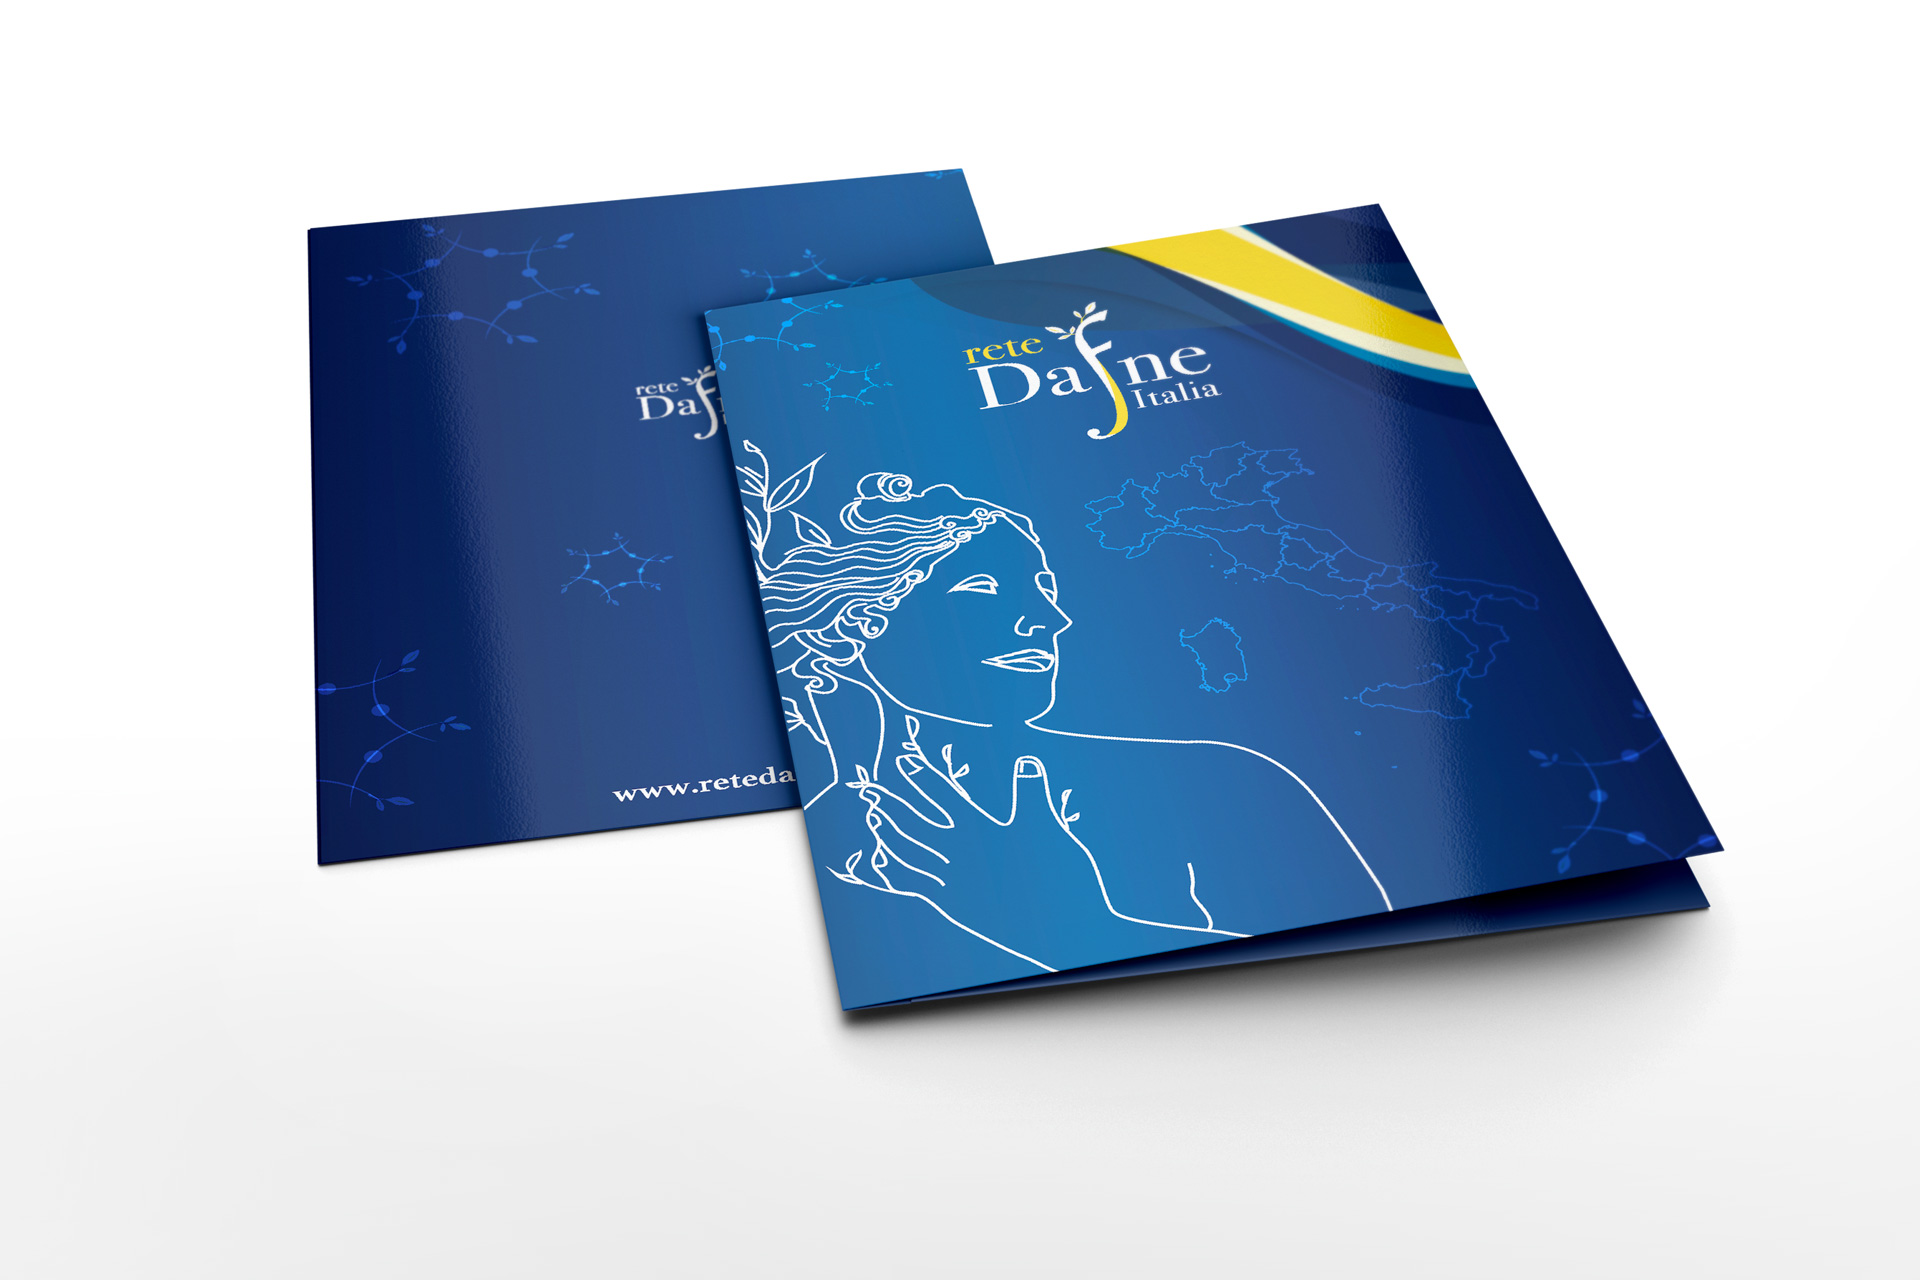
Logo Design and coordinated image: to create printed information materials, convention schedules, posters and infographics for annual reports.


Daphne is a character from Greek mythology. The myth of Daphne highlights the possibility of escaping violence and transforming himself, keeping intact his own integrity and beauty. The logo comes from a previous version revised in a conceptual key(is this the right word?). The study of the central lettering is inspired by a tree trunk, a symbol of solidity and rebirth. The logo is designed to allow derivations that can be used by all the nodes of the Network in the territory and allow them to use their brand as an associated hub.

  • App for data management

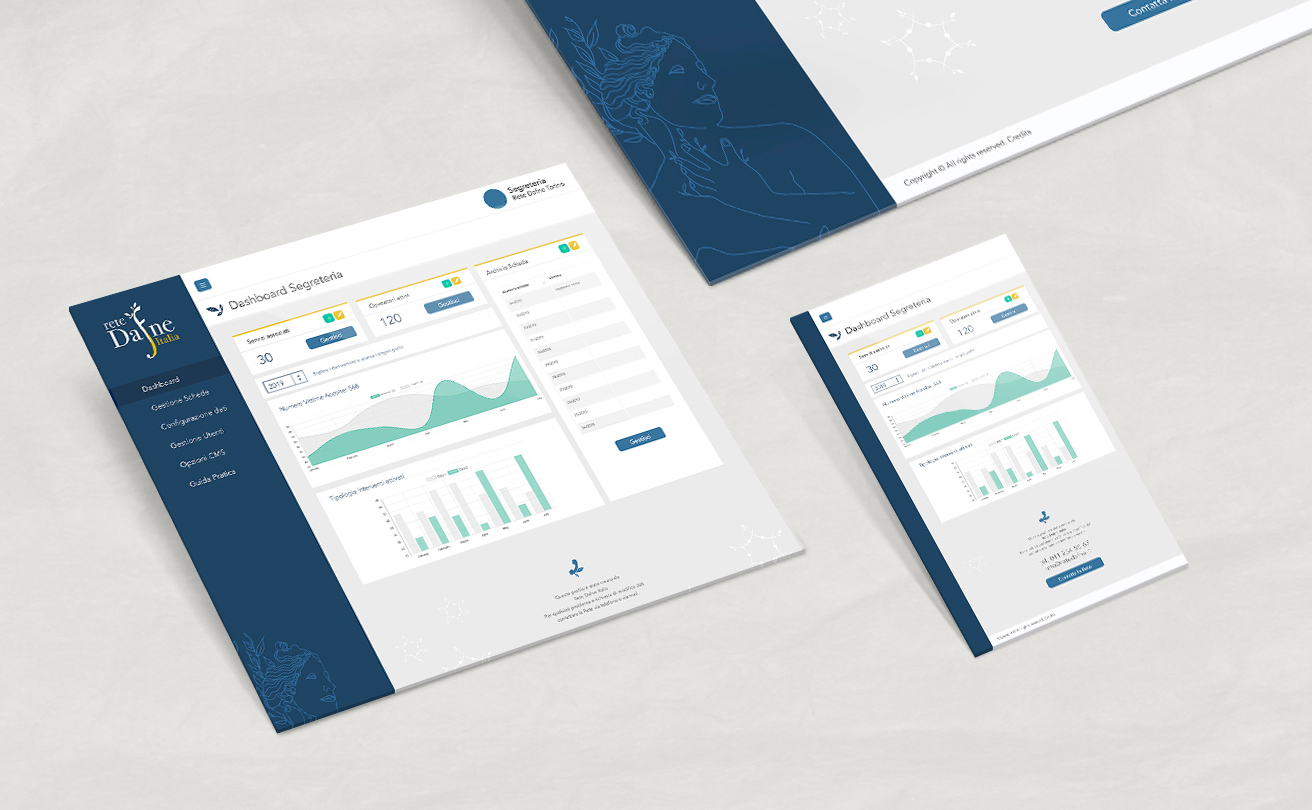
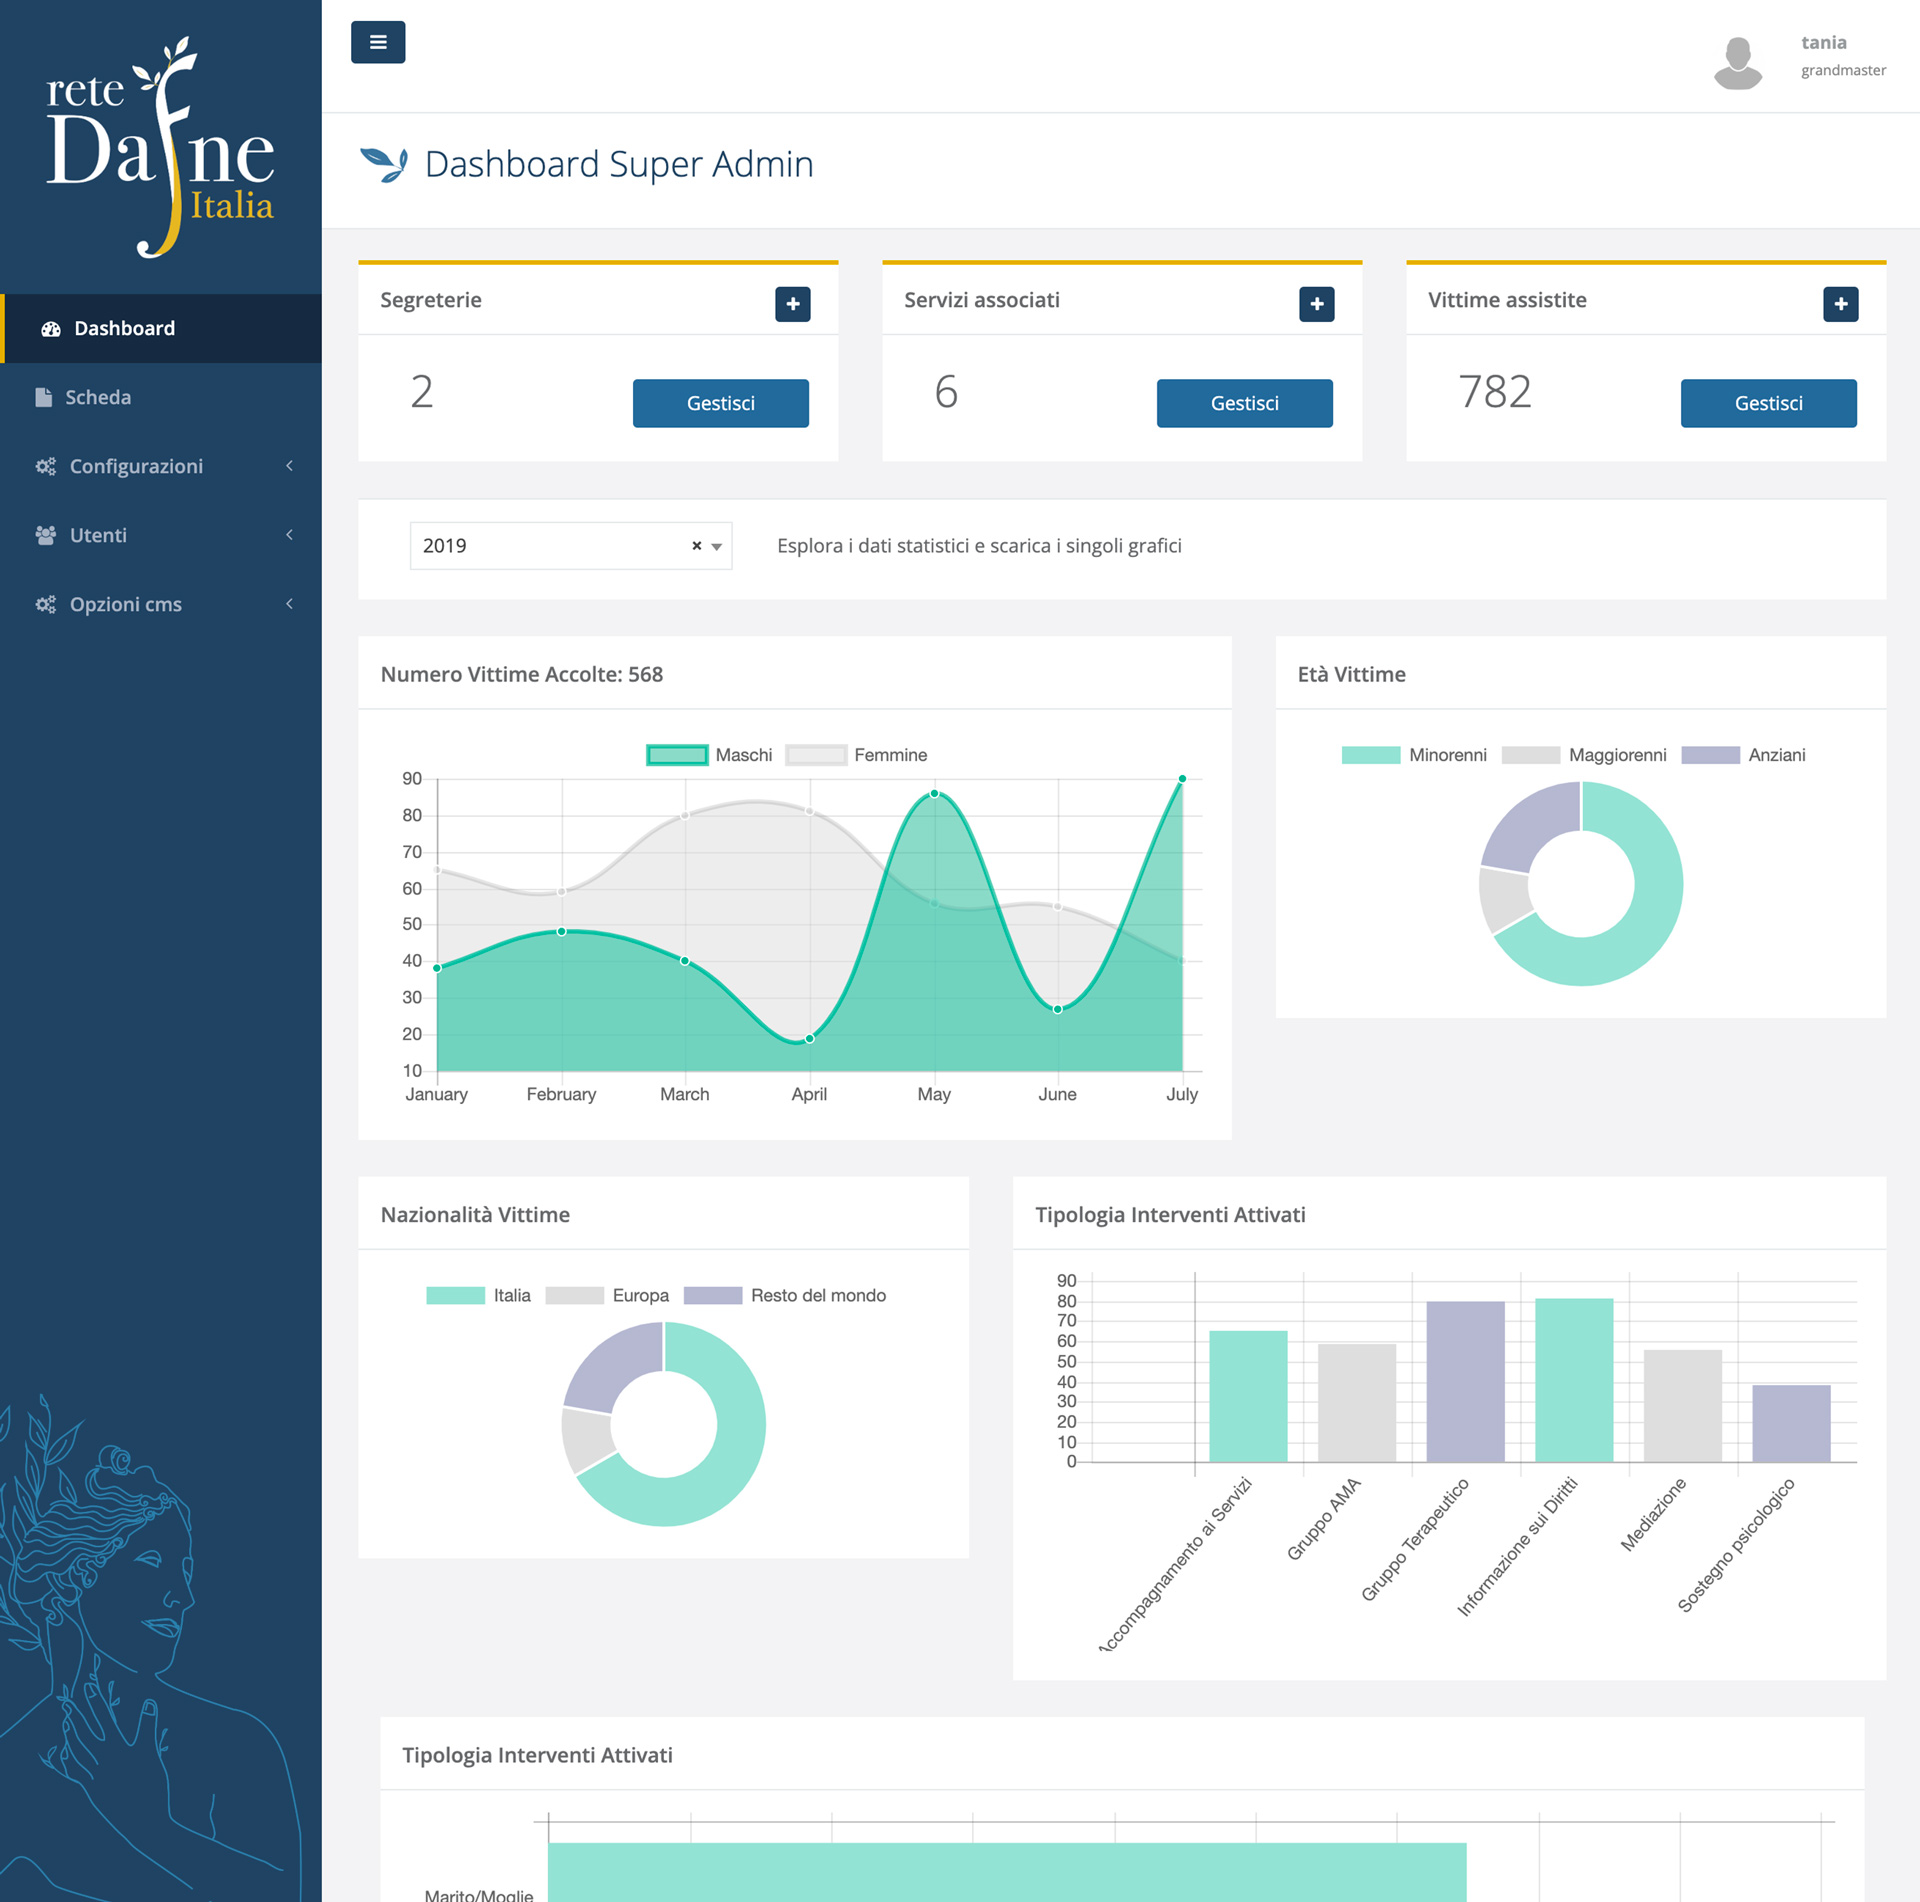
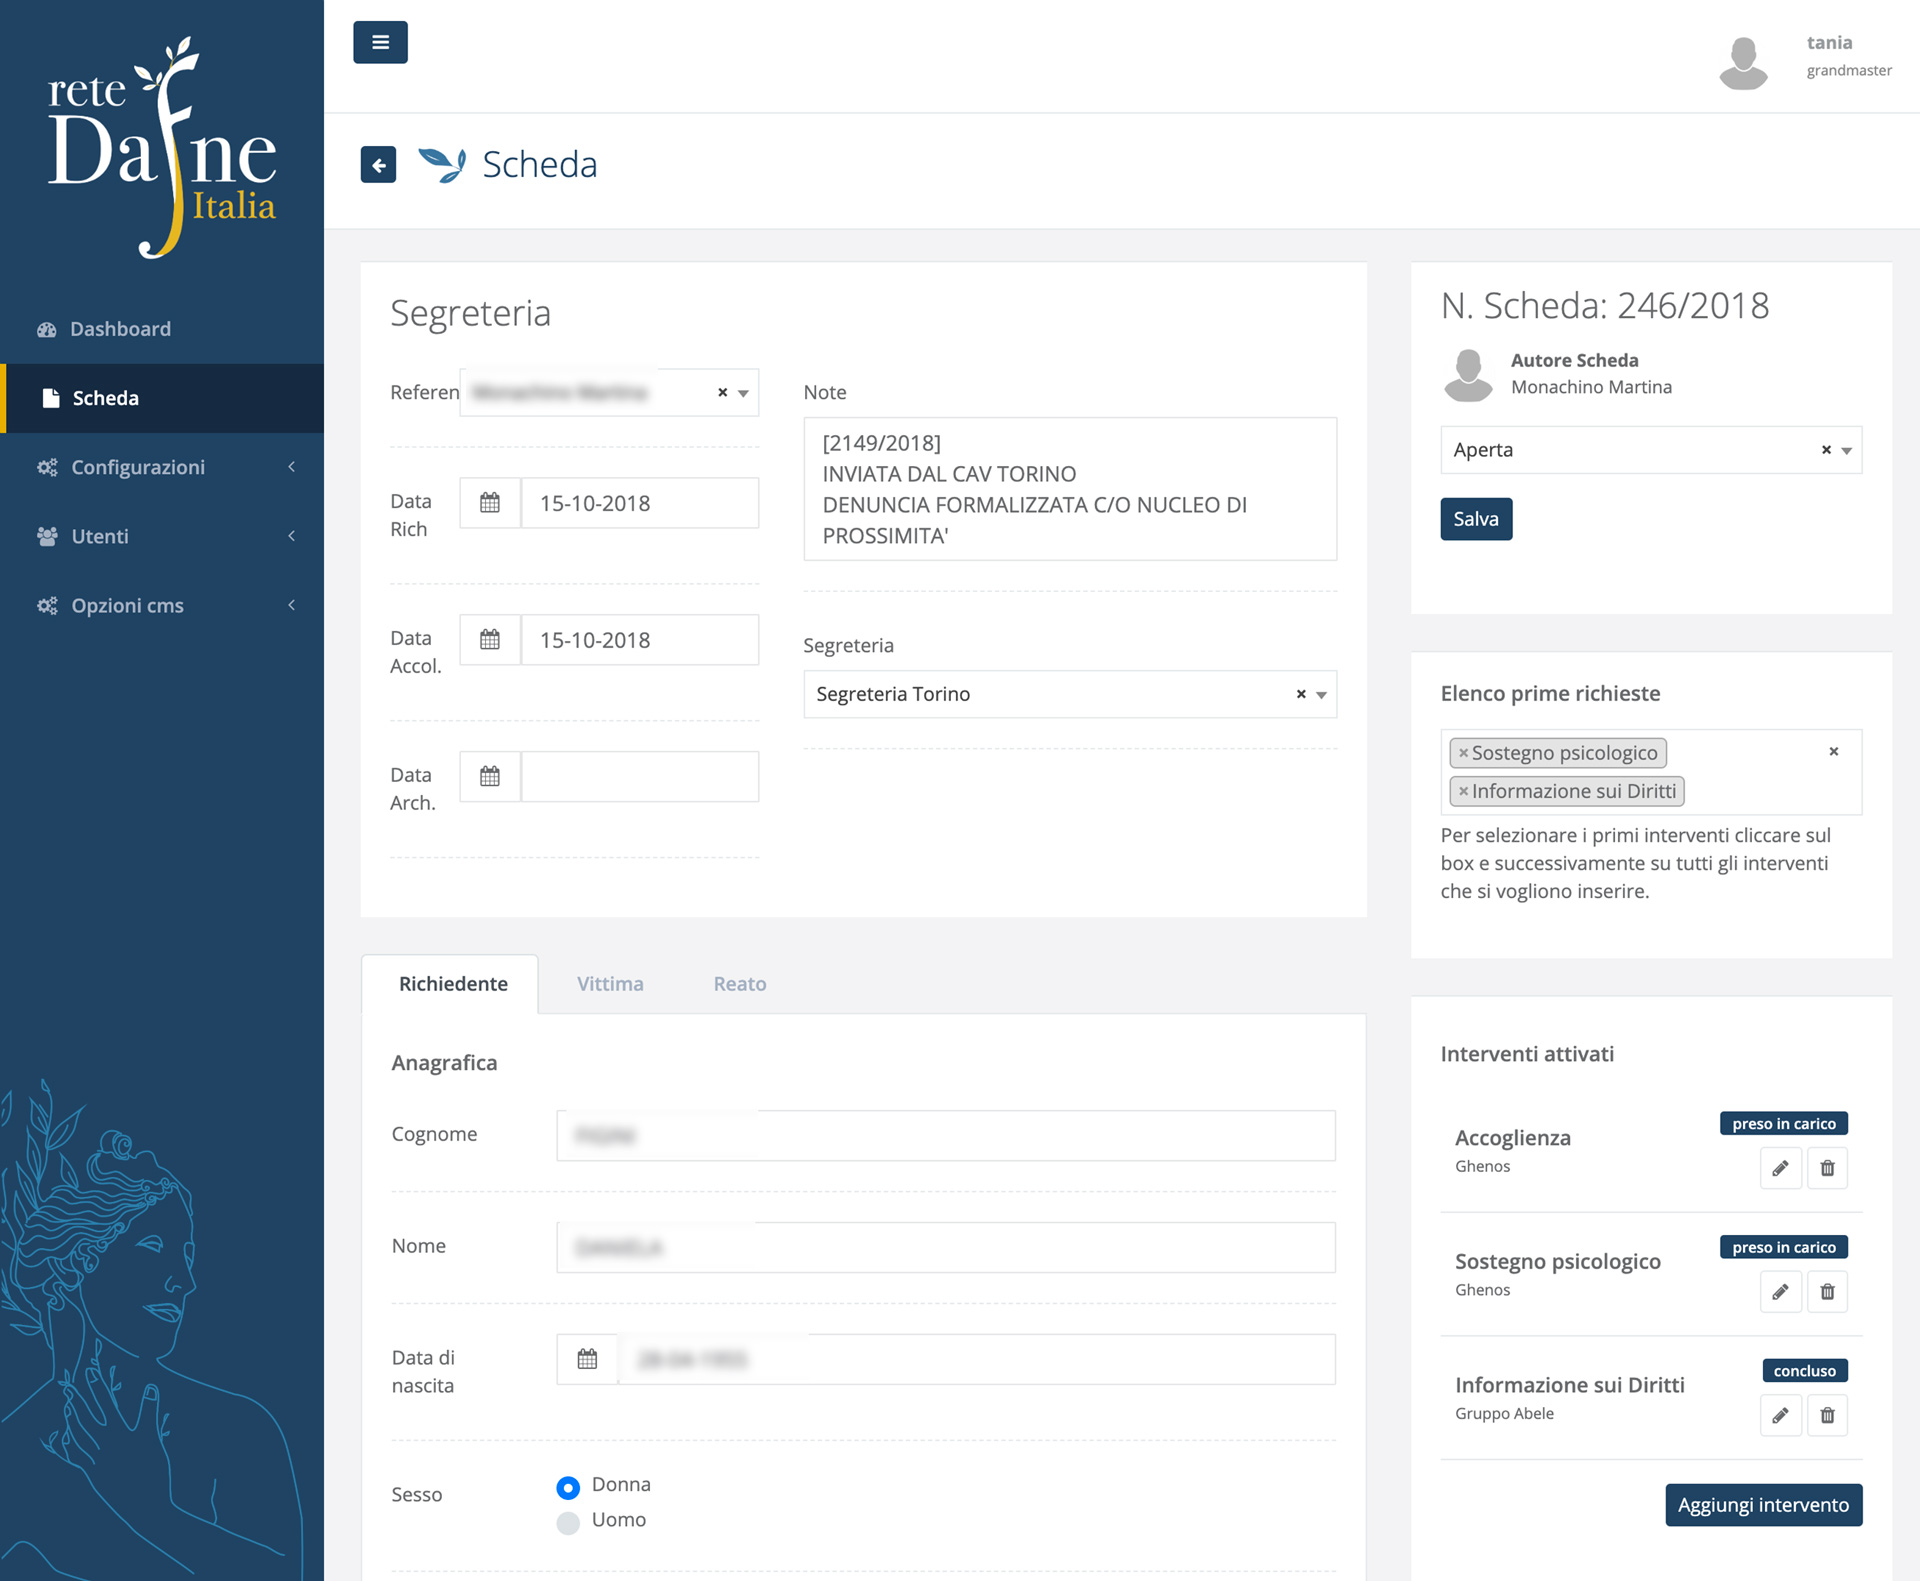
A digital system for data management to collect data from victims, to monitor the assistance and care received, to analyse significant data at a national scale.

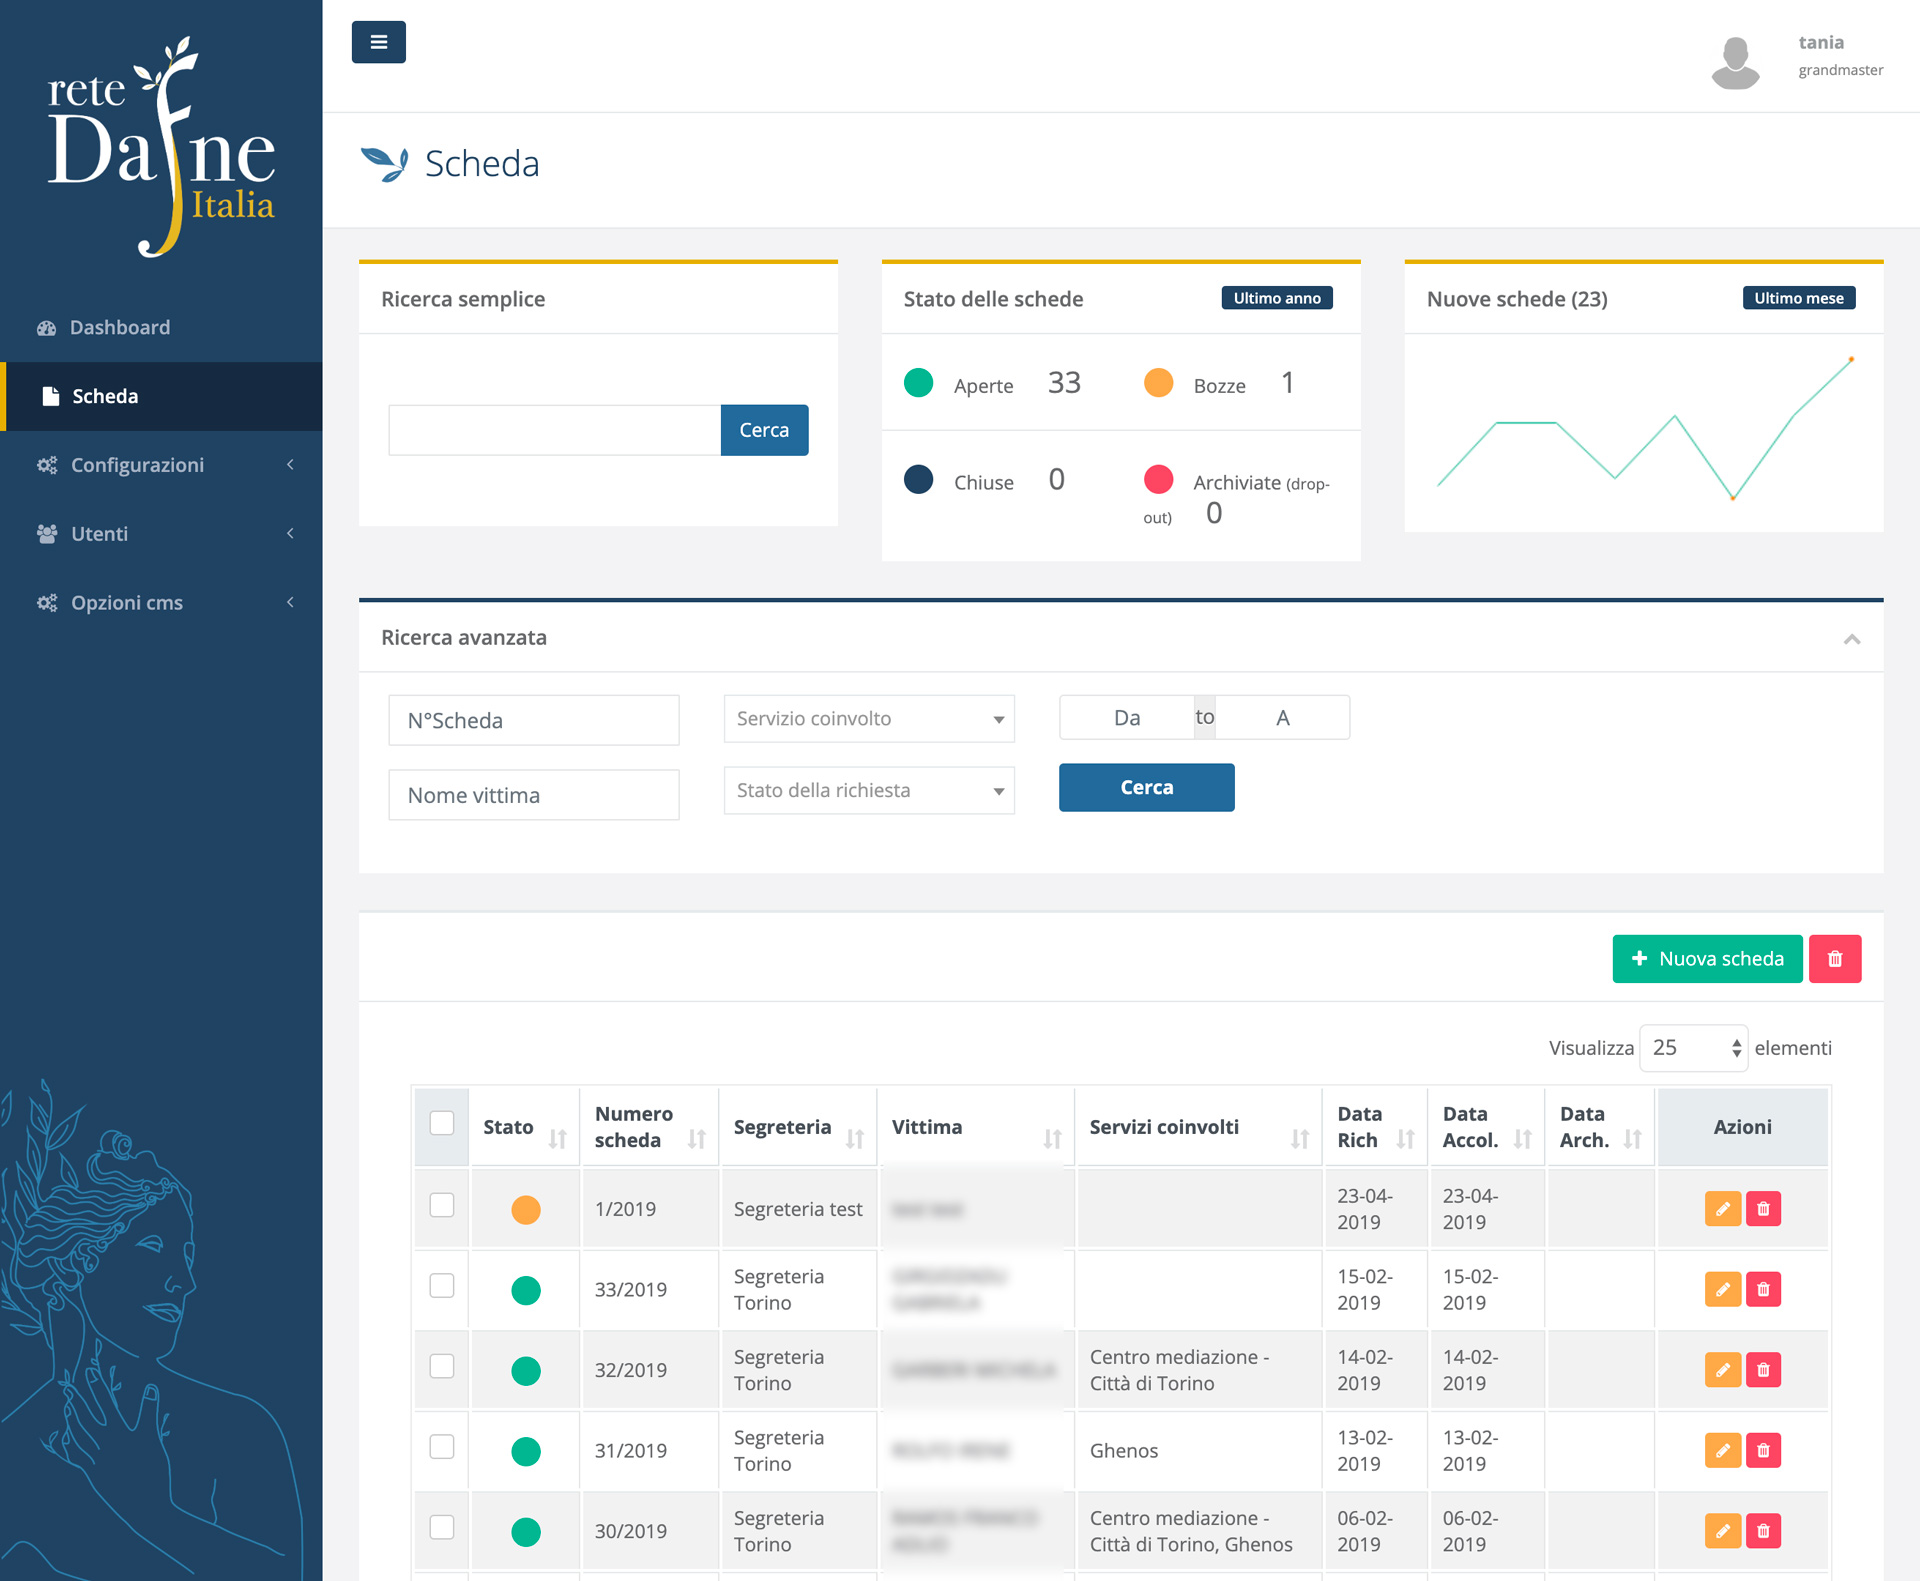
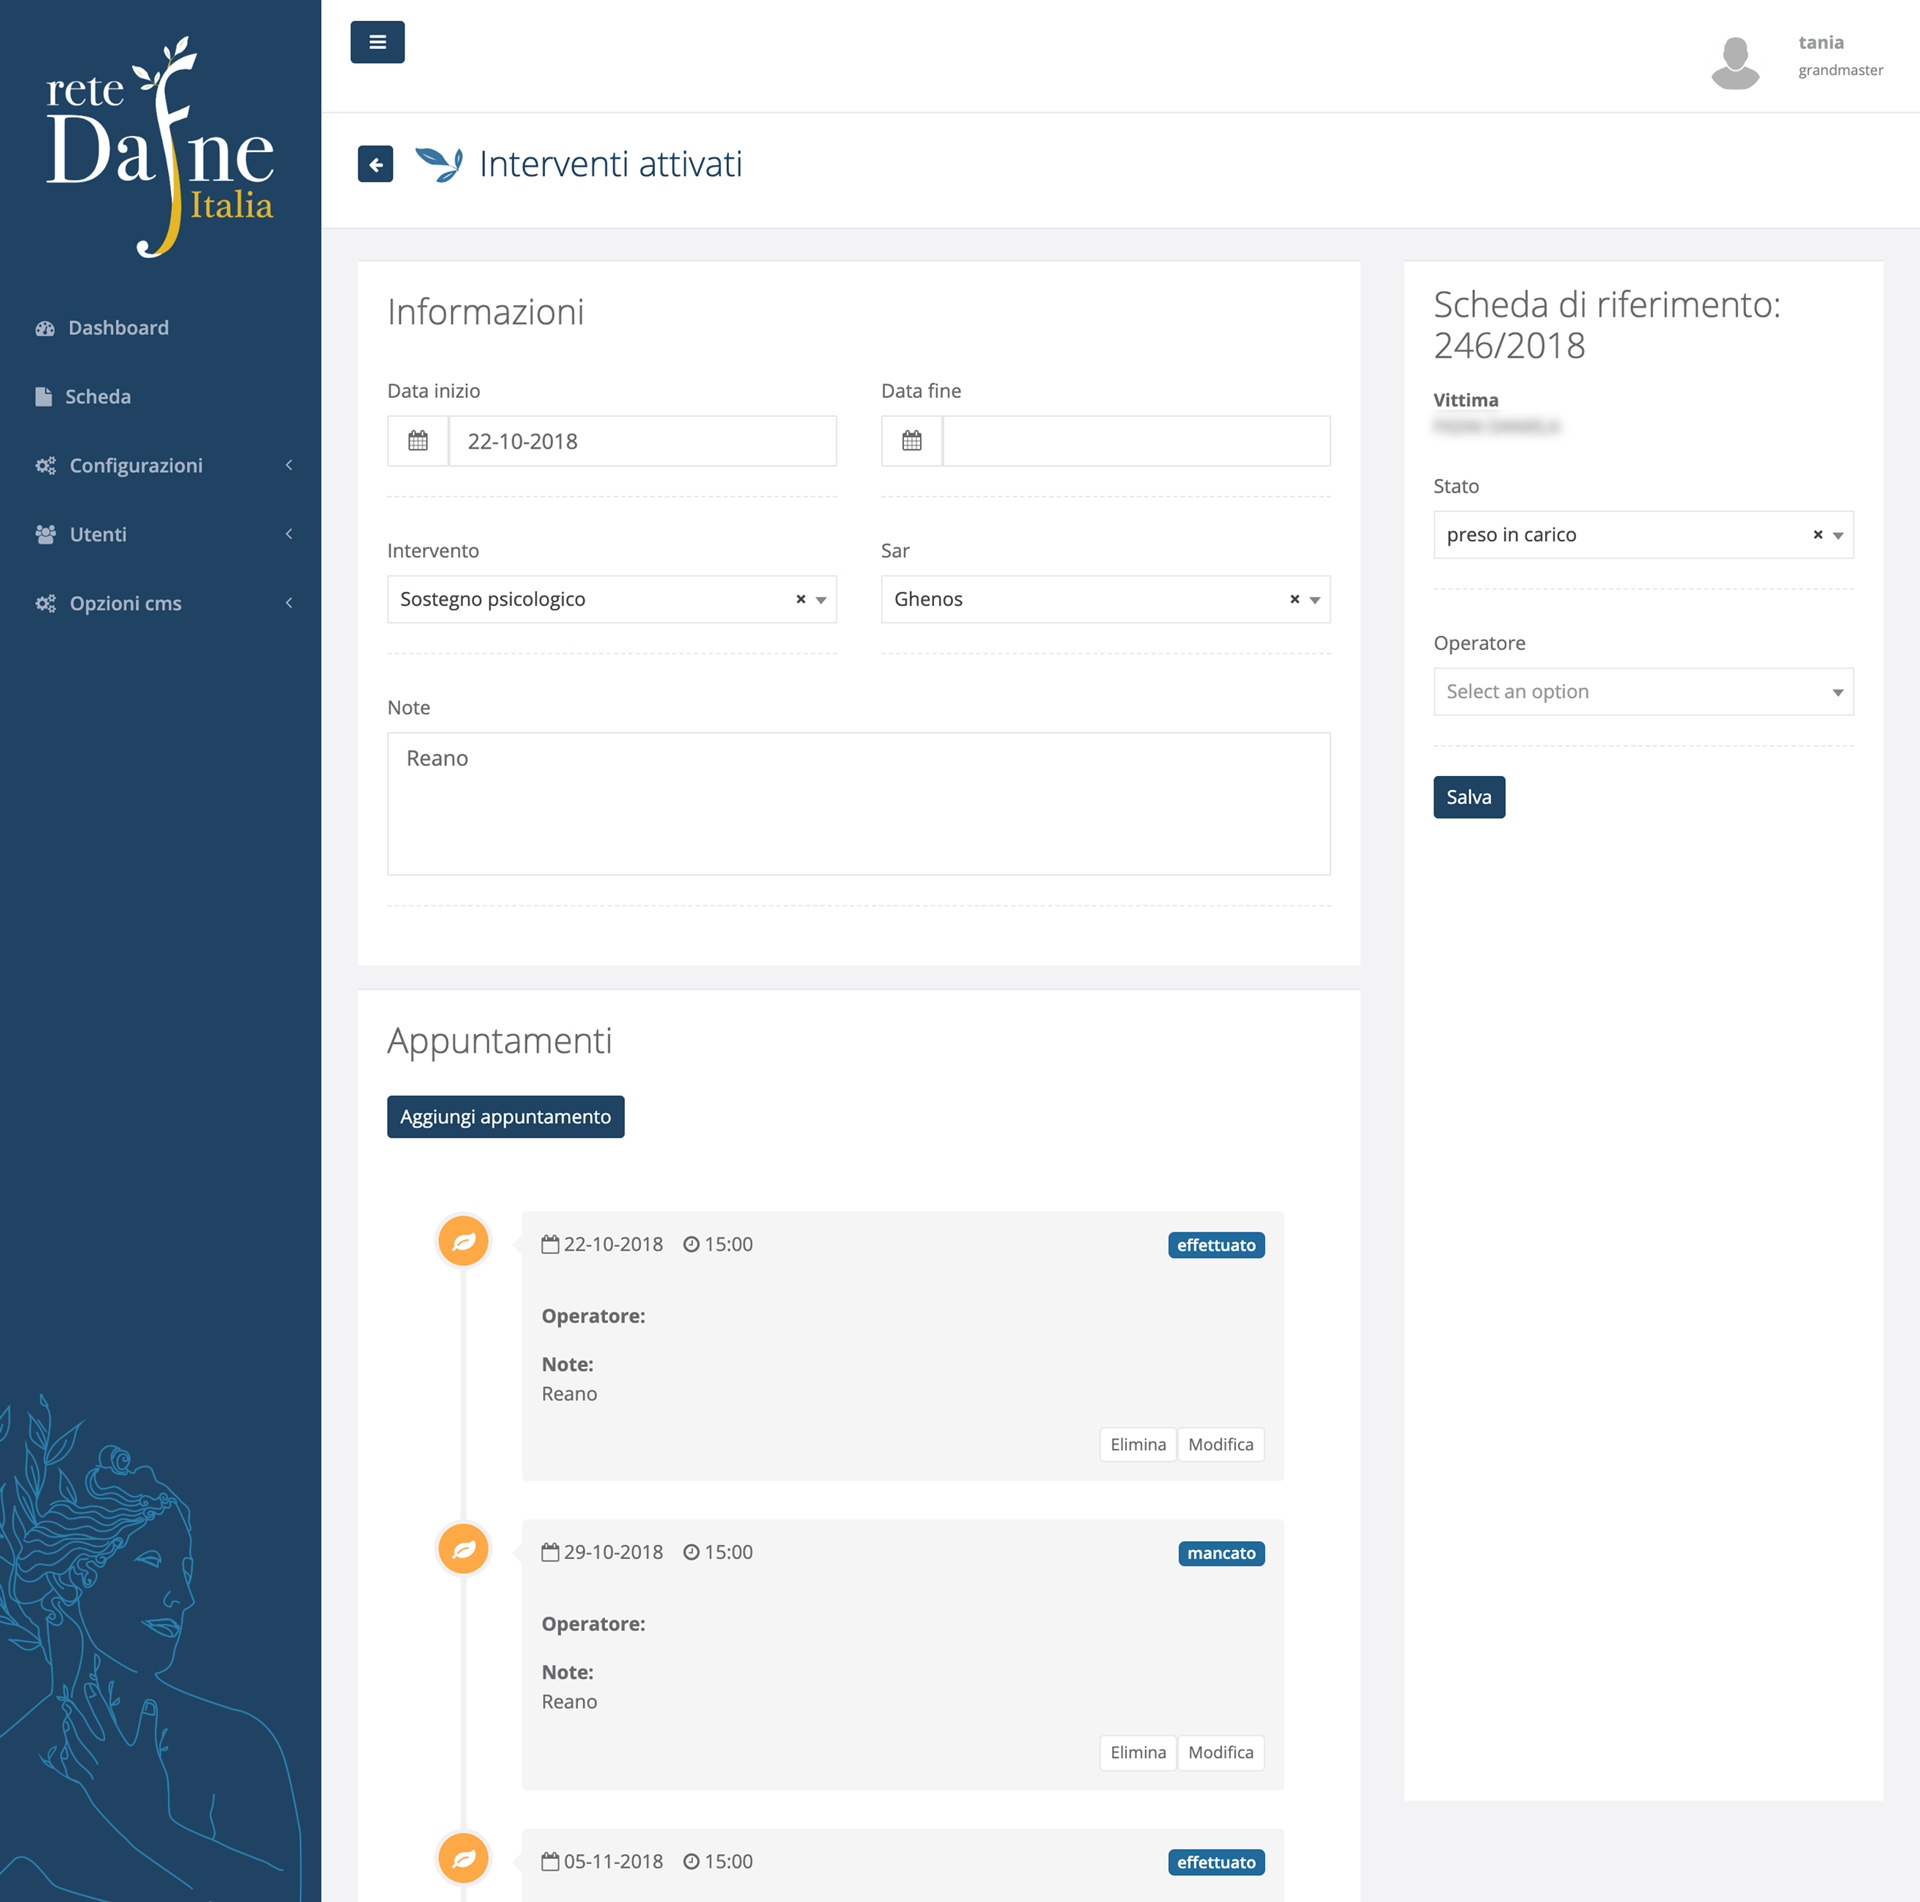
The app was created not only to record the data of the victims but also to create and manage the path of assistance and care that was provided at the beginning of the treatment of the person assisted. The activities are managed by different departments, each of which will use the application from a simple smartphone to create a calendar of activities and assign ratings and reviews on the progress of the path designed specifically for the person.

The Software is available for all the network hubs currently active in the national territory: Turin, Florence, Cagliari, Sassari. Each hub manages an internal cooperation of public and private organisations such as: hospitals, psychologists, lawyers, and associations that are interconnected through the application to assist and treat a person who is a victim of crime.

The system is secure and respects the privacy of data through different levels of permission assigned to different users. The highest level of permission is the administrator, Rete Dafne Italia, who can have access to the whole statistical reports studied in different levels of detail: from the national overview to the results of the single service active in the path of the treatment.

Services

UX UI Design, Project & Delivery Management

App Developer

Edit Web

Administrative role

Robin Studio

  • Interactive map

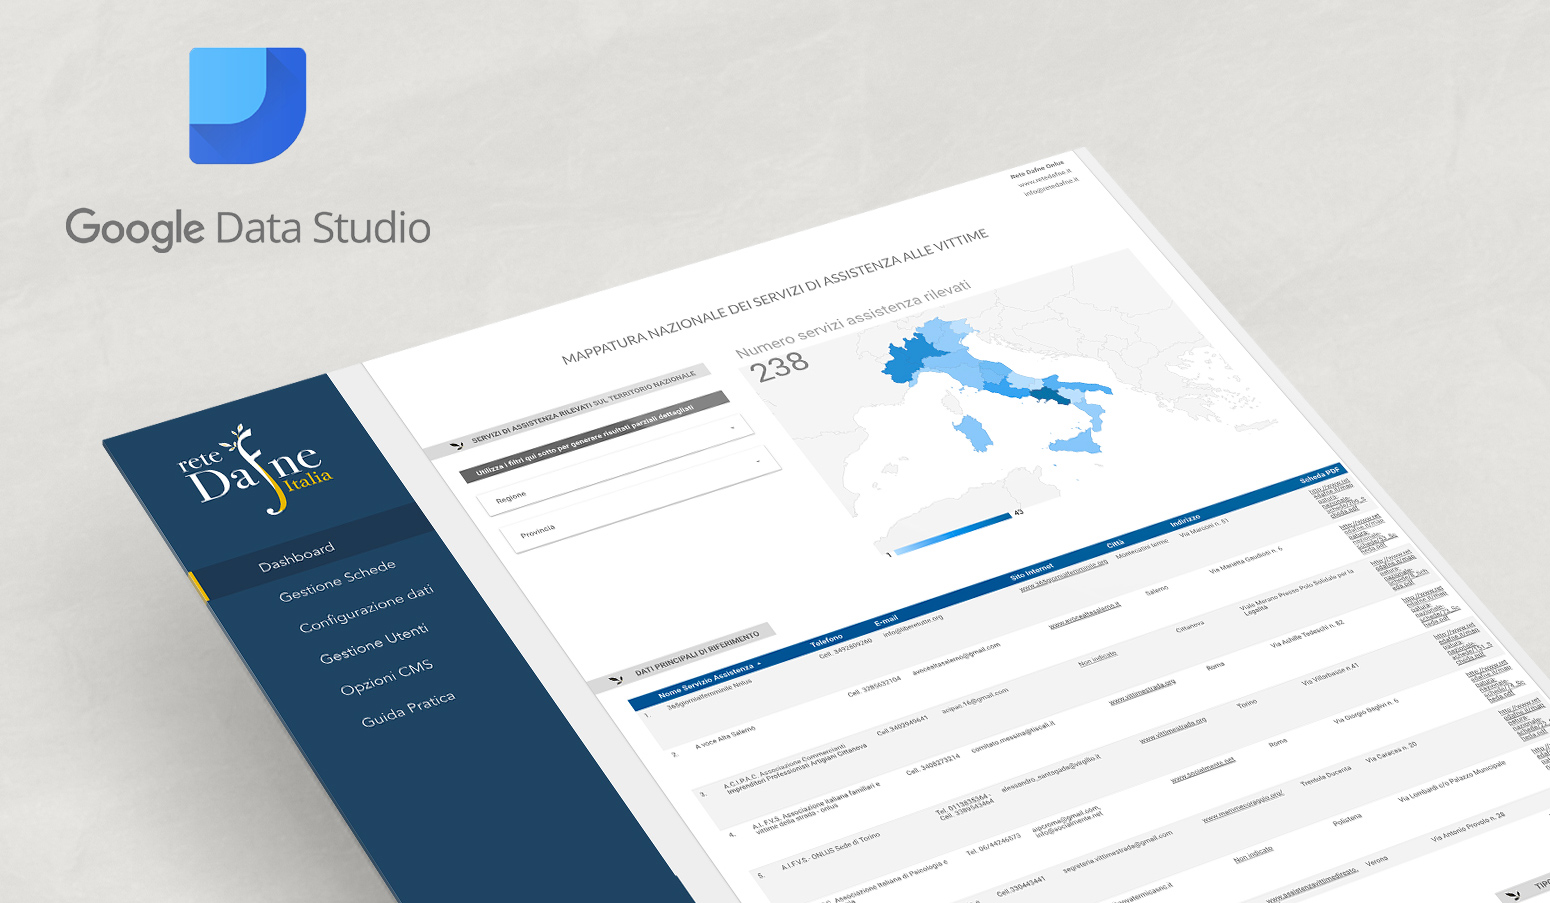
Thanks to Google questionnaires received from all over Italy, it was possible to process the data to create a map of the support services in Italy as well as cataloguing all their information and statistical data.

Data Studio is a Google tool used to create infographic dashboards used, in this case, to read and process the data of a spreadsheet and create an interactive map to extract the data of services active in each region. The level of detail goes up to the core of the services active in a given province.

The software was chosen for a very important feature: the report can be shared and consulted without the need for setup. A simple link is shared to make the data accessible. Data is updated in real time with the adding of new records into the source file. The source file is a Google data sheet that is also available for editing by multiple connected users.

Services

Data Analysis, Data Conversion and Data Studio Project Design

  • Data Visualisation

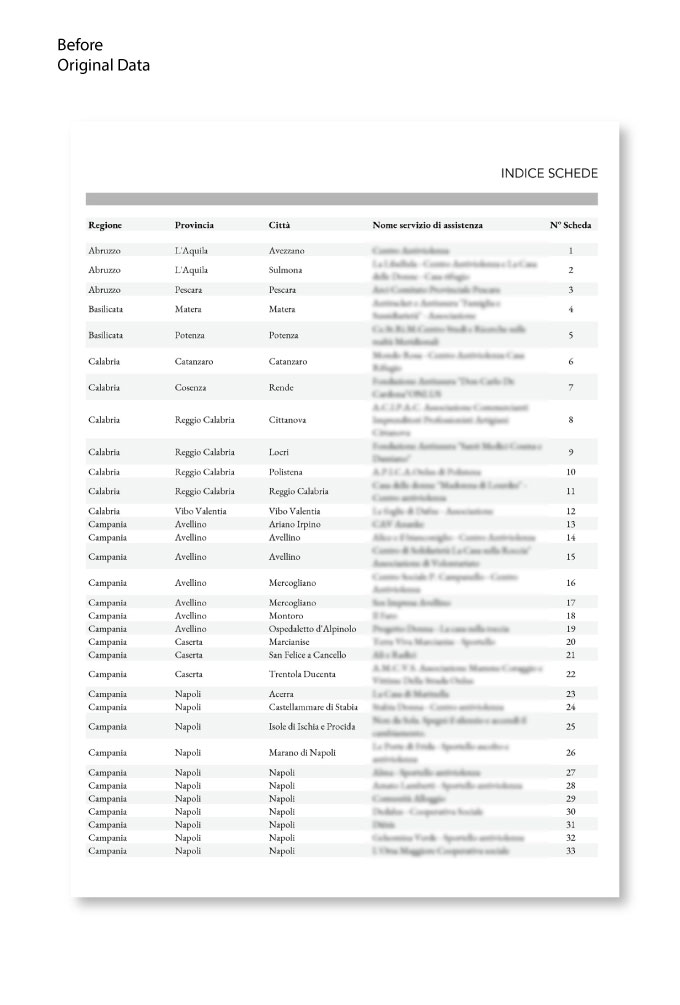
A software application developed specifically for the project was able to process the data of an Excel sheet and insert them into a graphical template. 238 data sheets, tables and dynamic images were rendered in 10 minutes.

Matomatic is a software that can render data from a database into graphical and infographic results. Originally designed to render data and infographic animations, the software has been adapted to export to PDF document format.

Services

Data Analysis, Infographics

Software developer

Mateusz Polek (Robin Studio)

  • Web Design

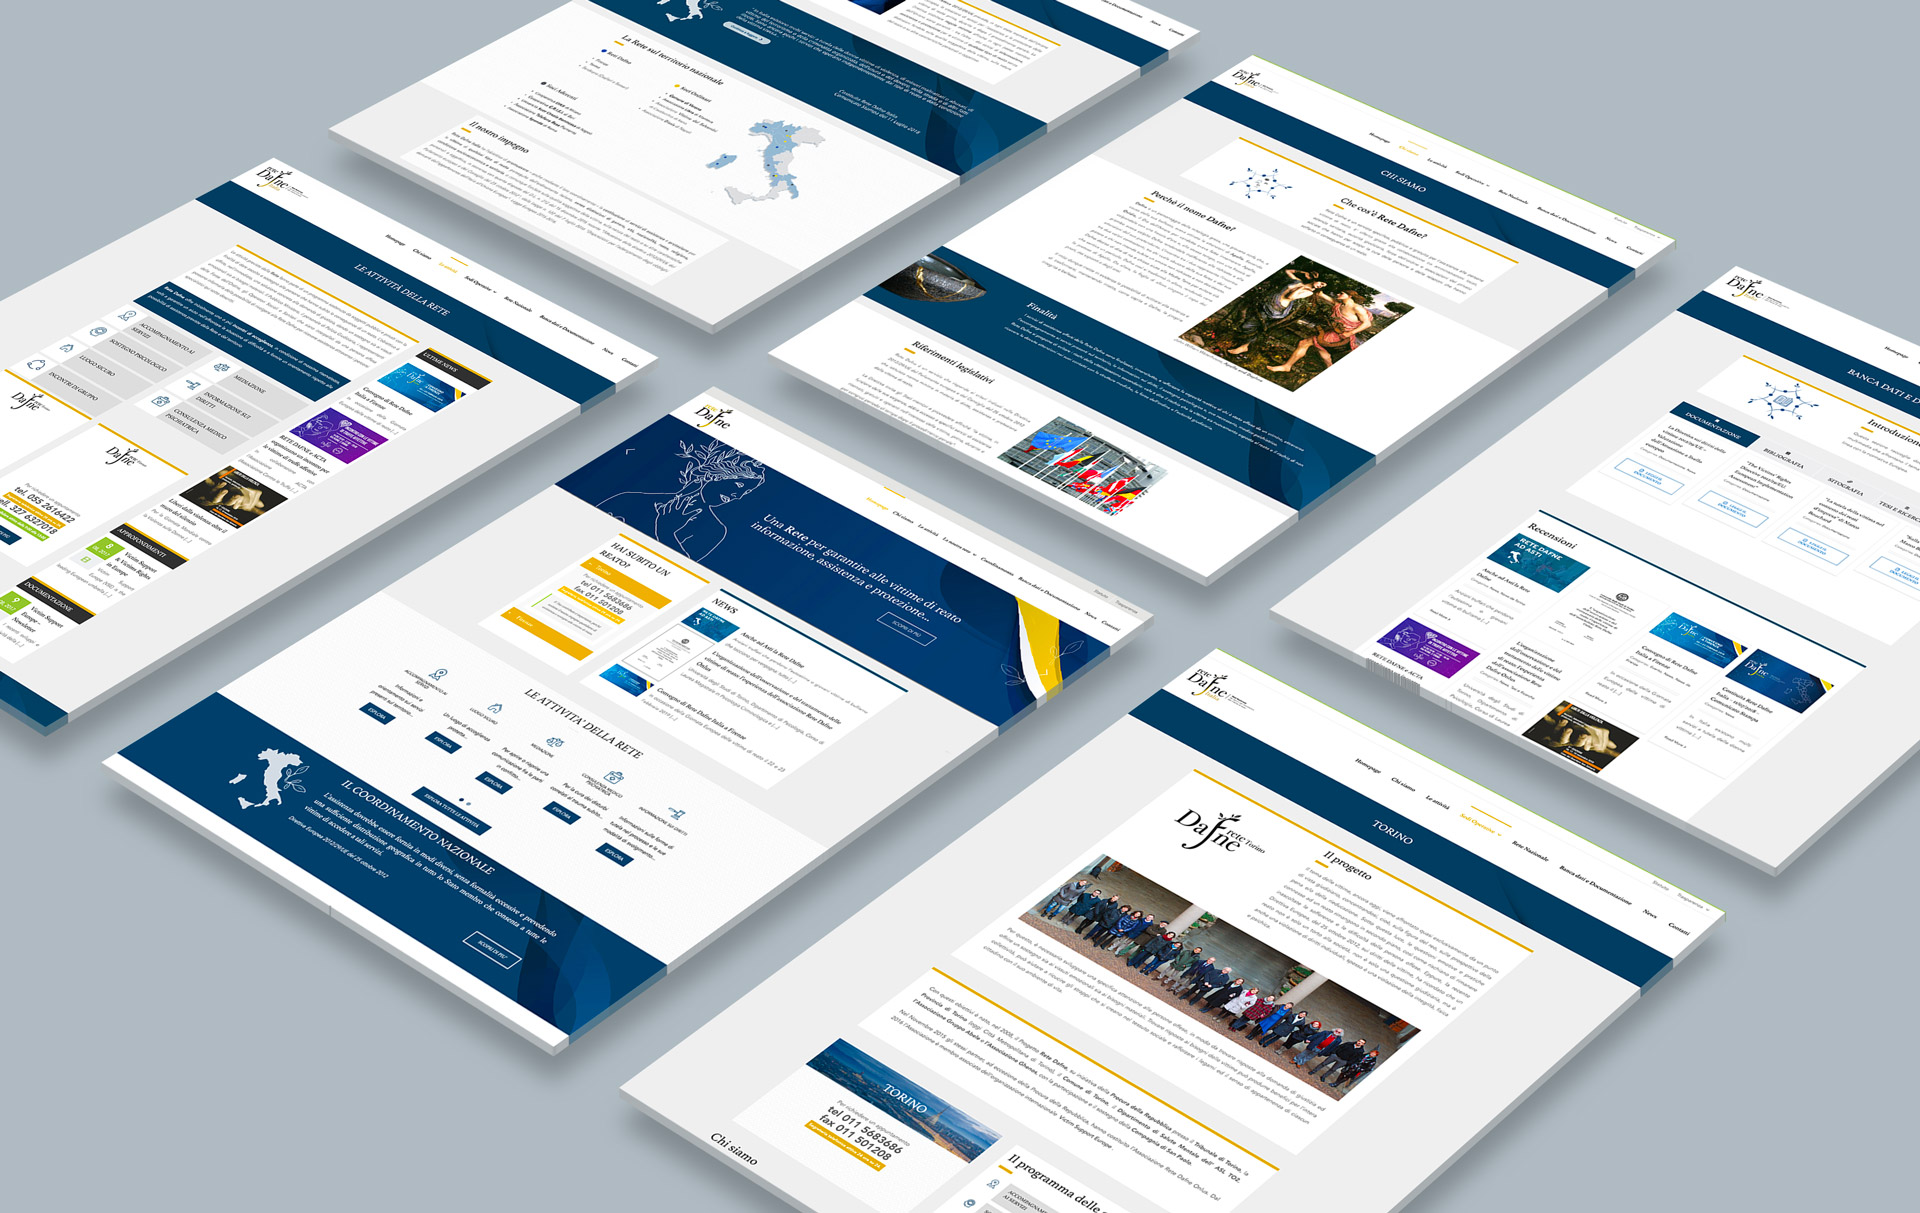
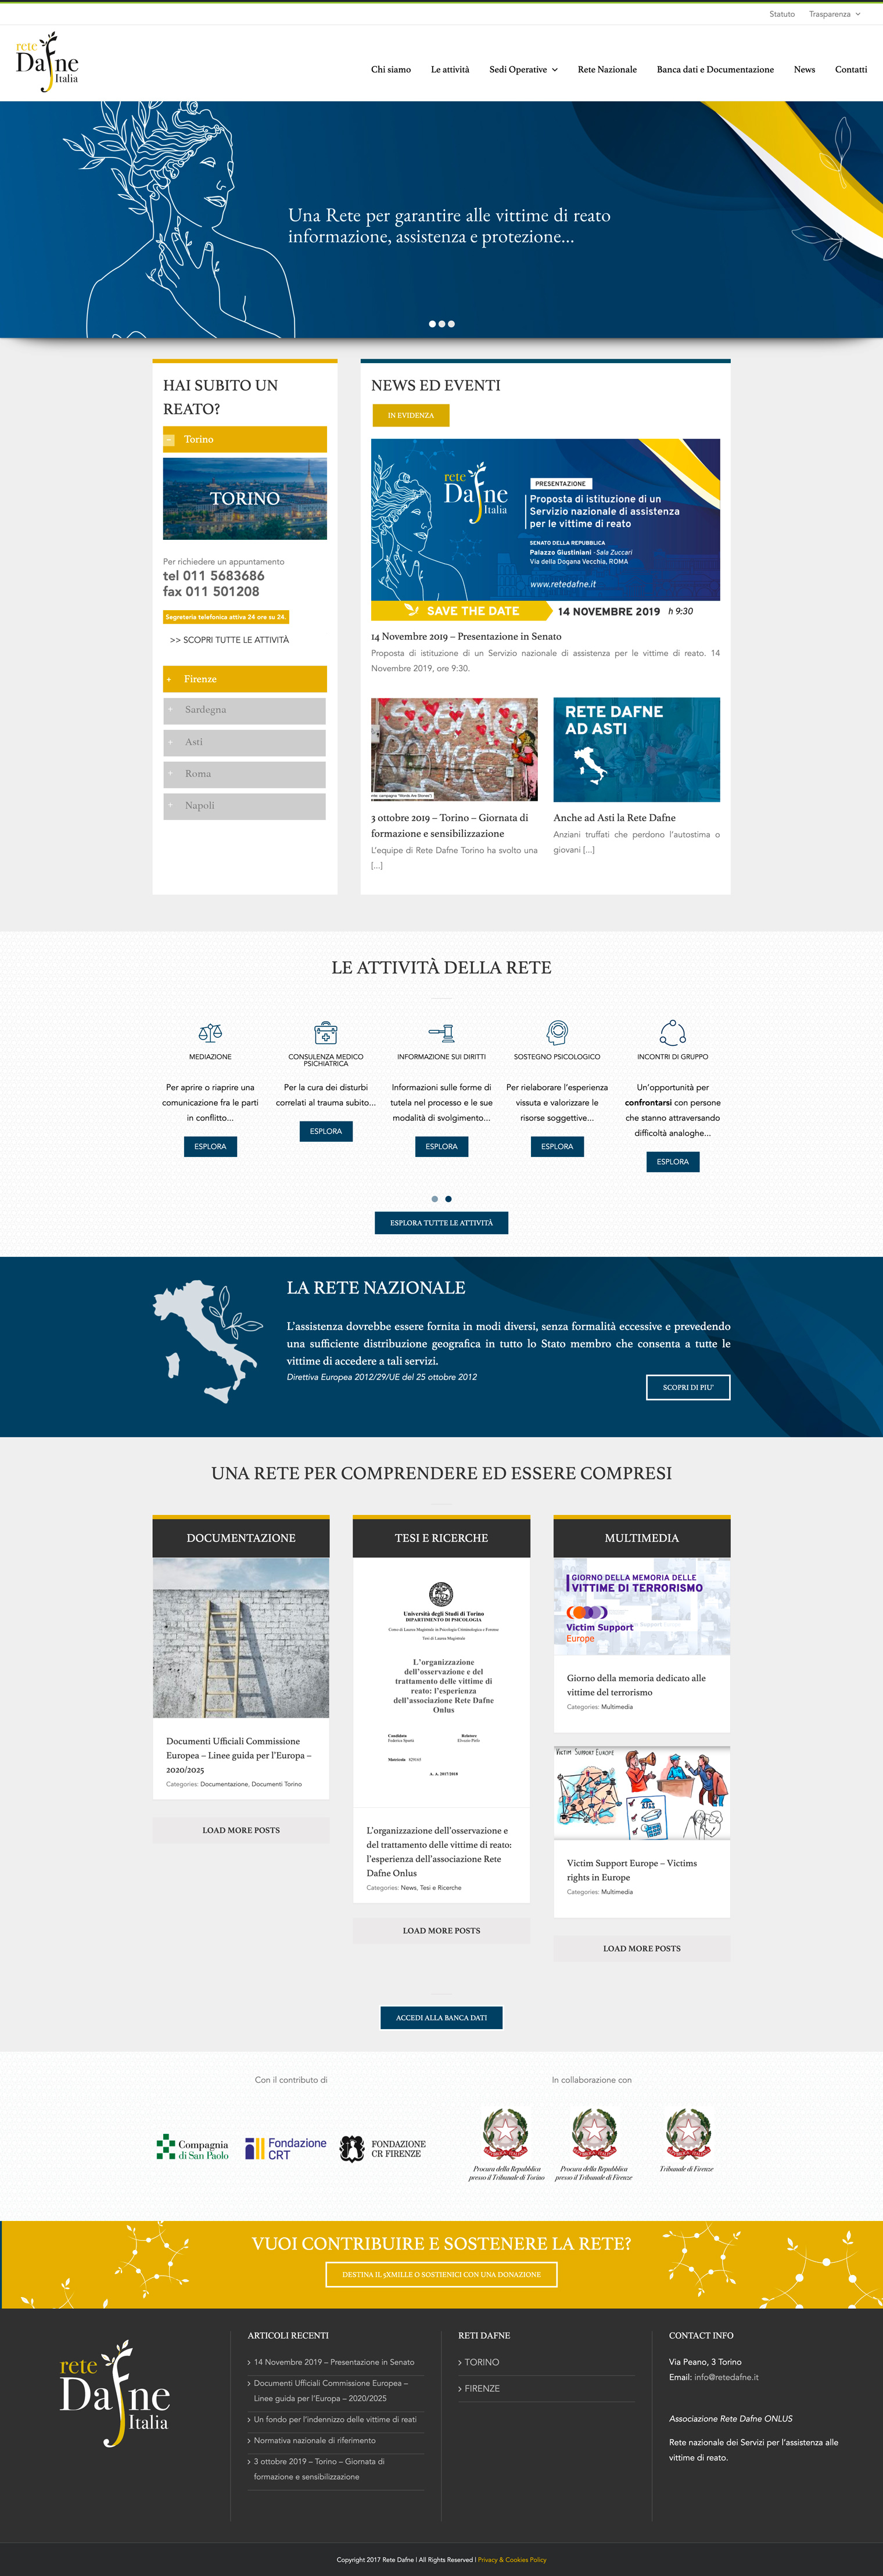
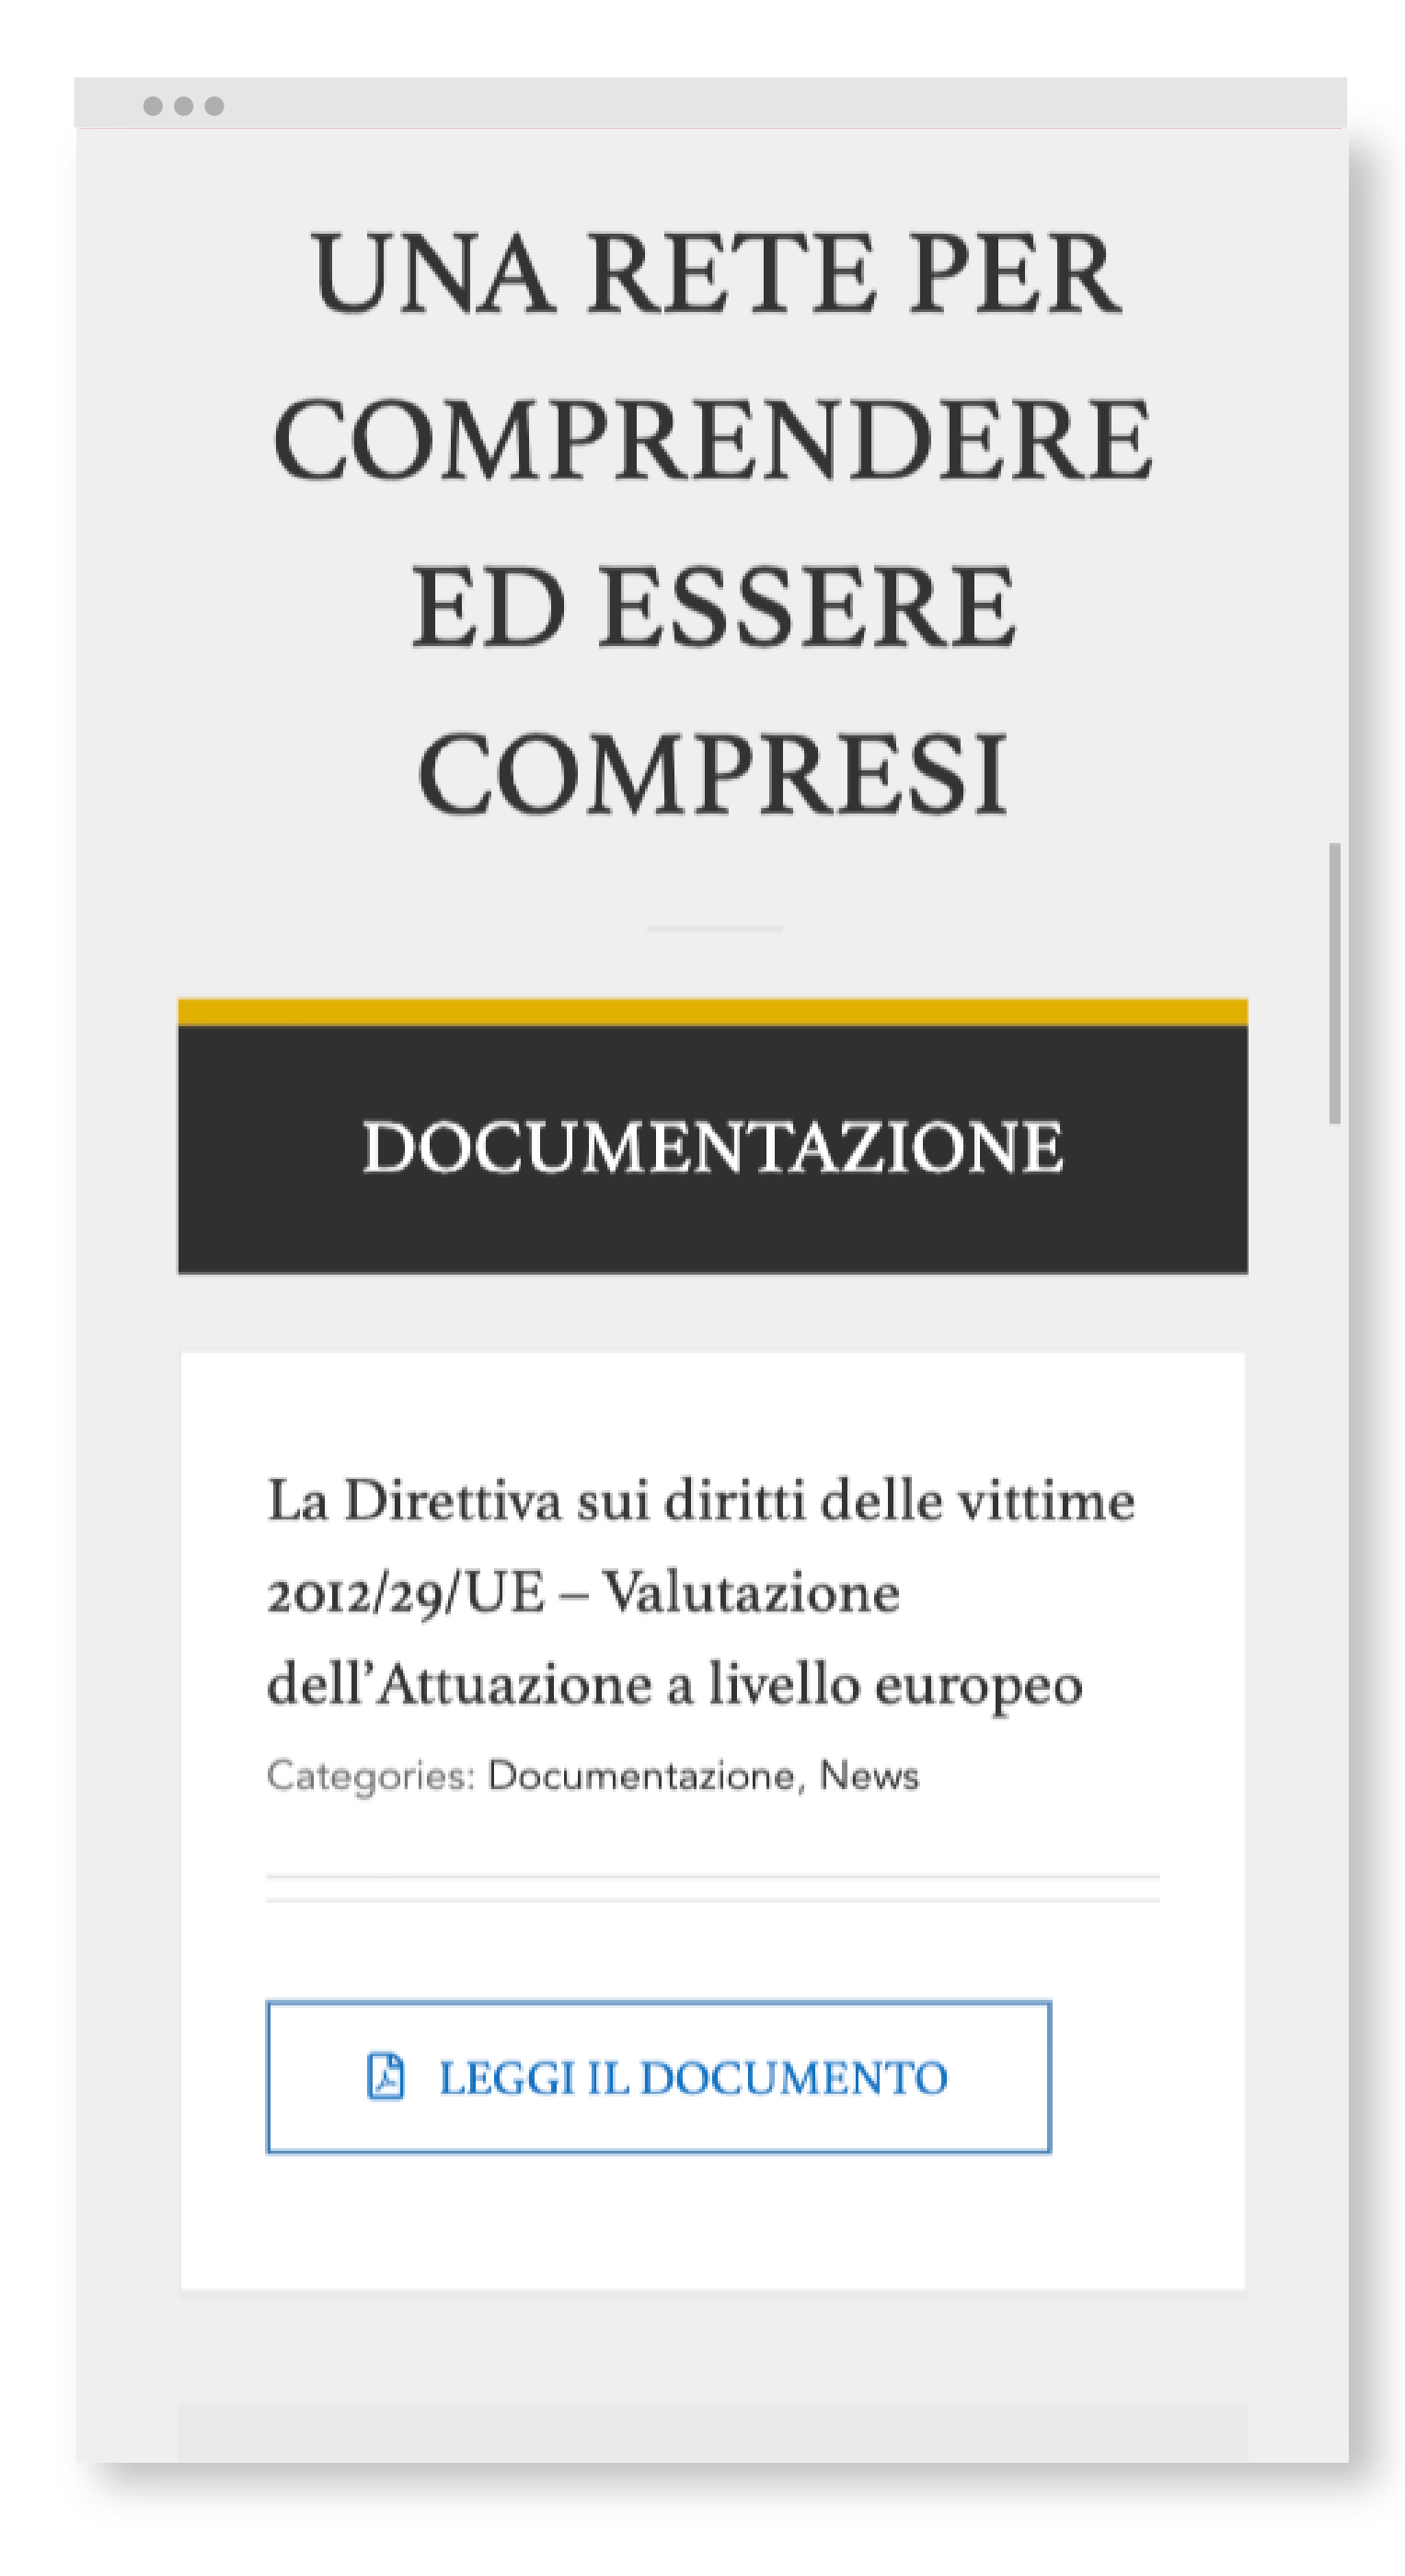
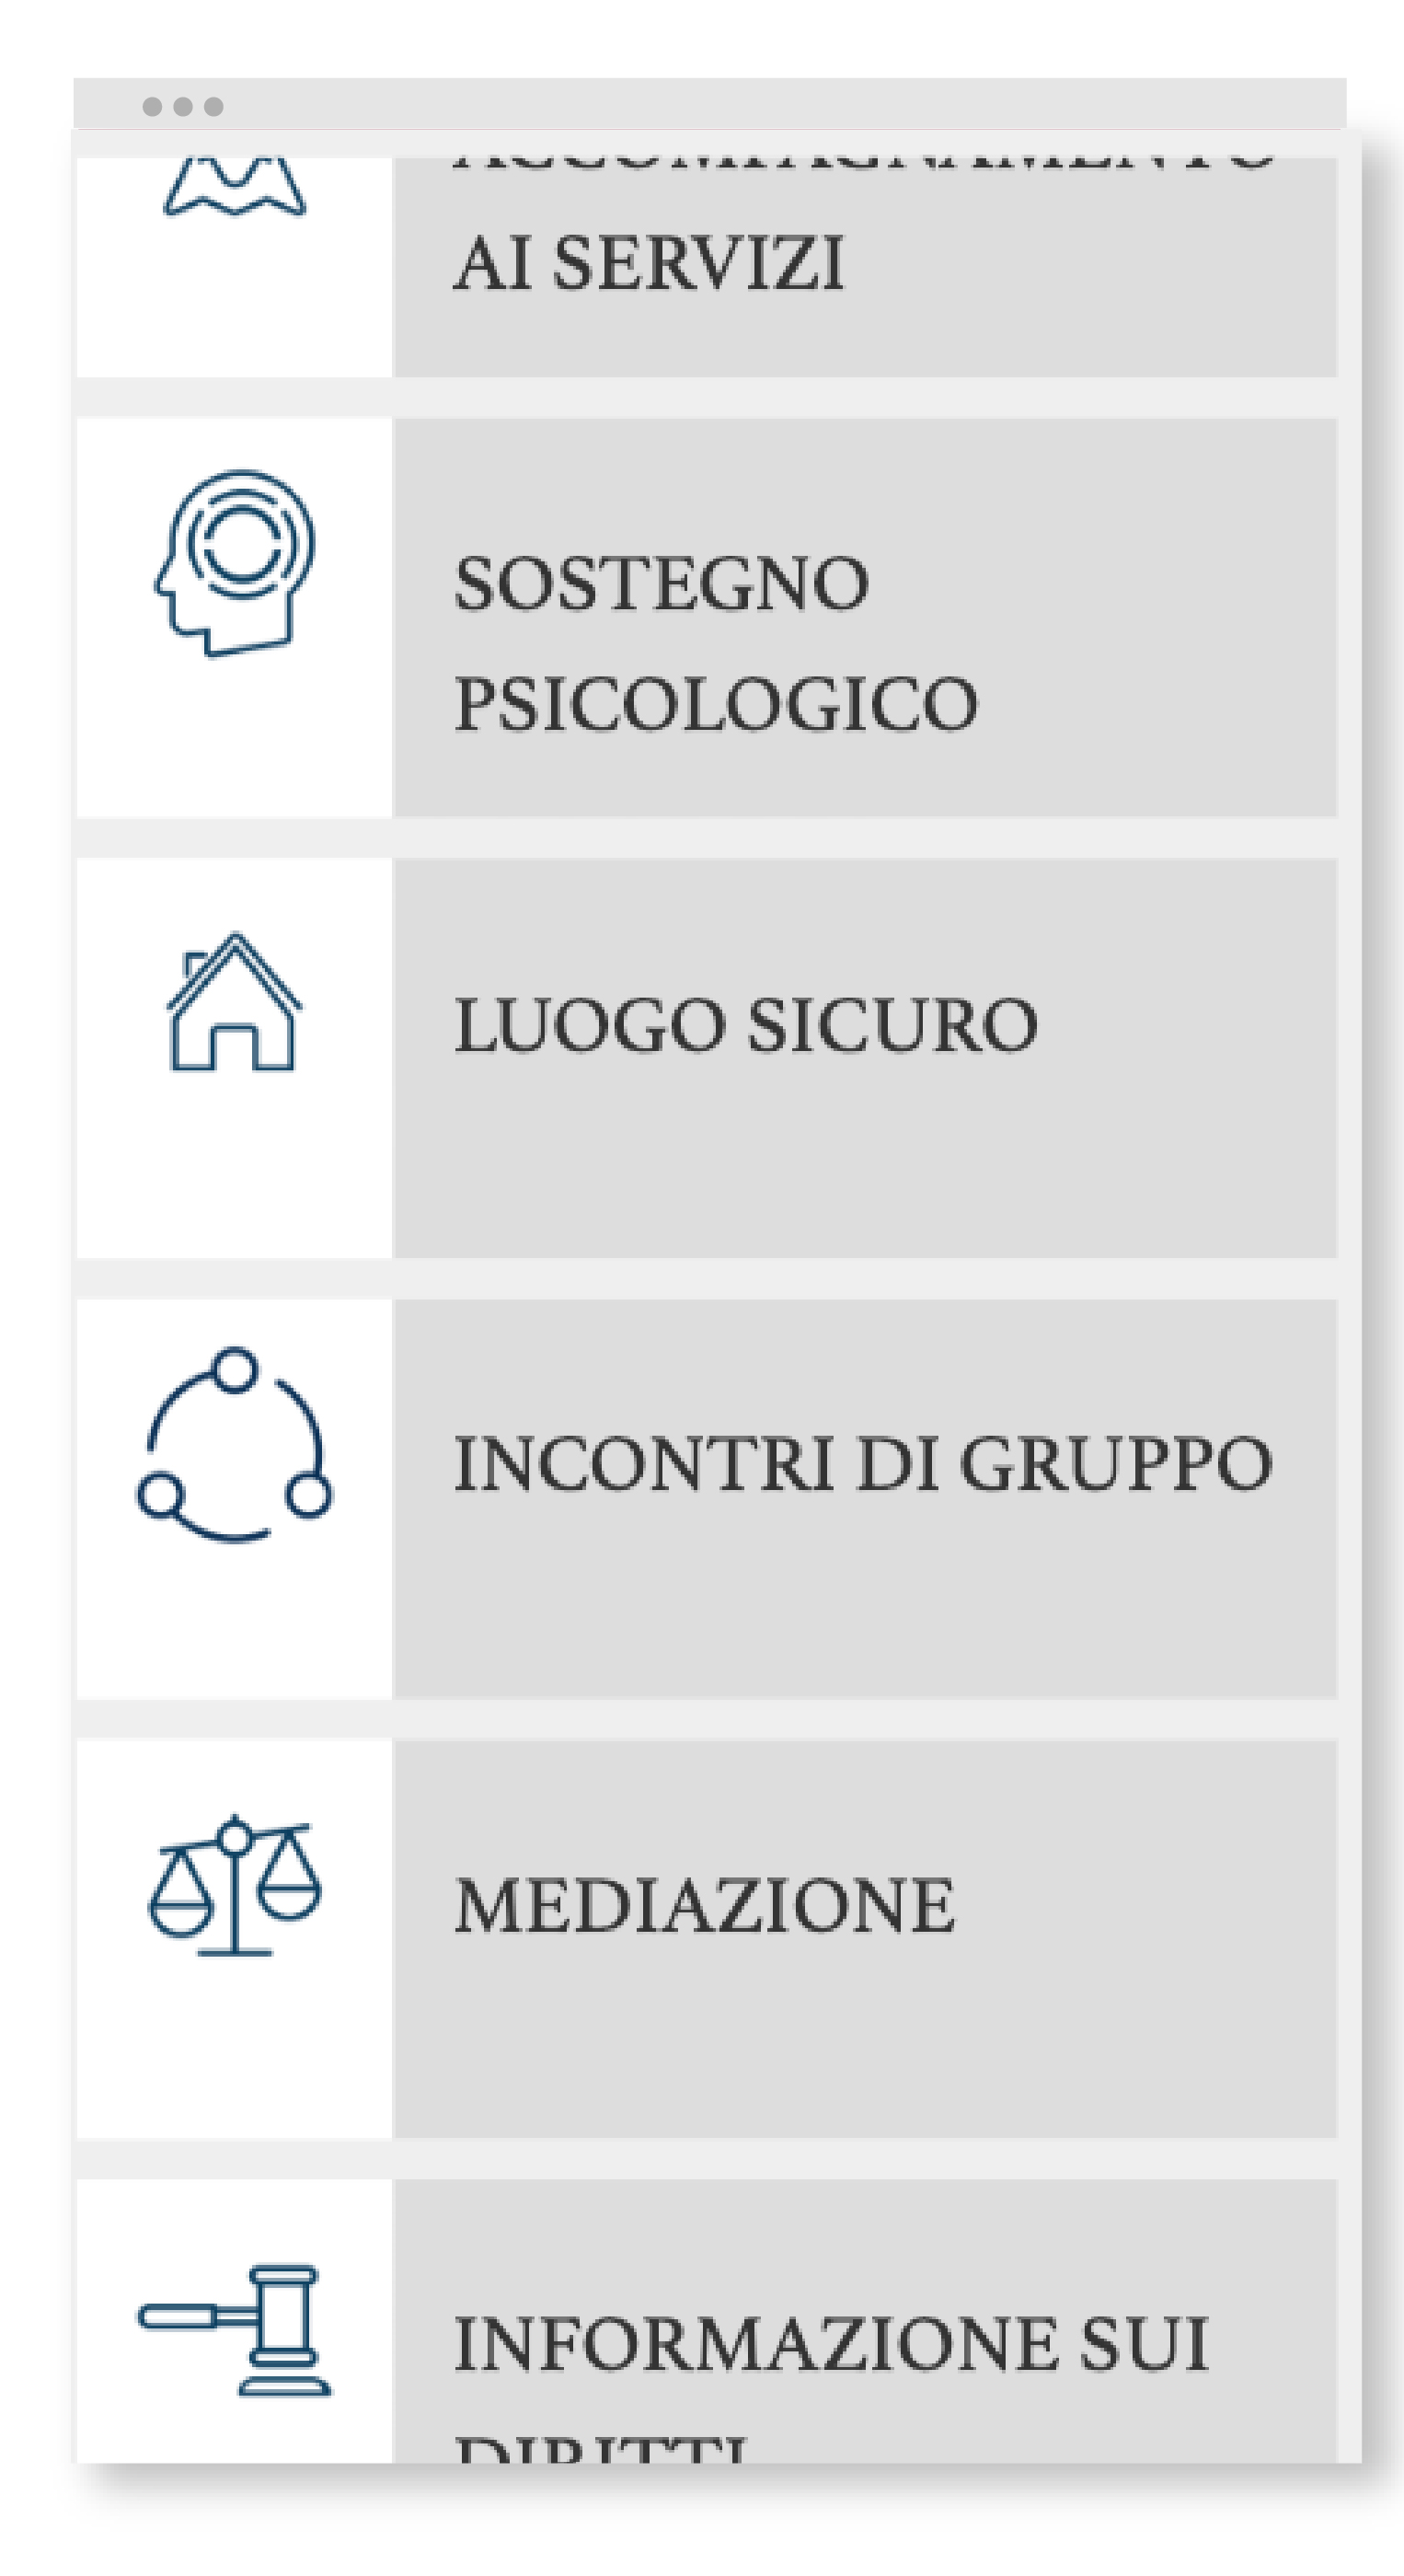
A website available to people for immediate assistance and a database of information and documents available to academics, researchers and professionals.

Services

UX UI Design